
The national minimum wage: 25 years on
It is now just over a quarter of a century since a national minimum wage was introduced in the UK. Once a source of controversy due to fears that it would lead to fewer jobs, the policy has instead proved to be highly successful. Stephen Machin reflects on how it has reduced wage inequality - and what needs to happen next.

Even in April 1999, £3.60 was not a lot of money, but it was a big deal. It was the hourly rate of the UK's first national minimum wage (£3.00 for 18-21-year-olds), and the idea then was that it was better to start low and evaluate, rather than run the risk of setting it too high. There were still concerns being expressed in many quarters that a minimum wage could lead to job losses despite research, including several studies from CEP, finding no evidence that wage floors damage employment.
The Low Pay Commission, which was set up to make recommendations and monitor the impact of the minimum wage, suggested the £3.60 rate in its first report. This proposal drew on written evidence from 500 organisations, more than 200 visits to meet businesses and workers around the country, and cited more than 350 research studies.
The UK is a relatively high minimum wage country: the national living wage is now £11.44 an hour for those aged 21 or over

The rate did not stay low for long. The UK is now seen as a relatively high minimum wage country. By 2022 it was the eighth highest in 25 Organisation for Economic Cooperation and Development countries. What is now known as the national living wage (a new floor introduced in 2016) rose to £11.44 an hour for those aged 21 and over on 1 April 2024.
The economic effects of minimum wages have been a controversial area over the years, with much of the debate about whether or not wage floors negatively affect employment. But here I am interested in another question: how minimum wage regulations have affected wages and their distribution.
The distribution of wages has become more unequal in the UK since 1980. For much of the earlier part of that period, wages for workers higher up the distribution rose more quickly than for those lower down. More recently, patterns have changed somewhat, as the peak level of hourly wage inequality was reached in the early to mid-2000s, with reductions since then, but with the overall inequality level still higher than it was in 1980.
Figure 1 shows patterns of real wage growth at three percentile points of the wage distribution from 1980 to 2023, and inequality ratios between them.
Figure 1: Wage inequality, 1980 to 2019.
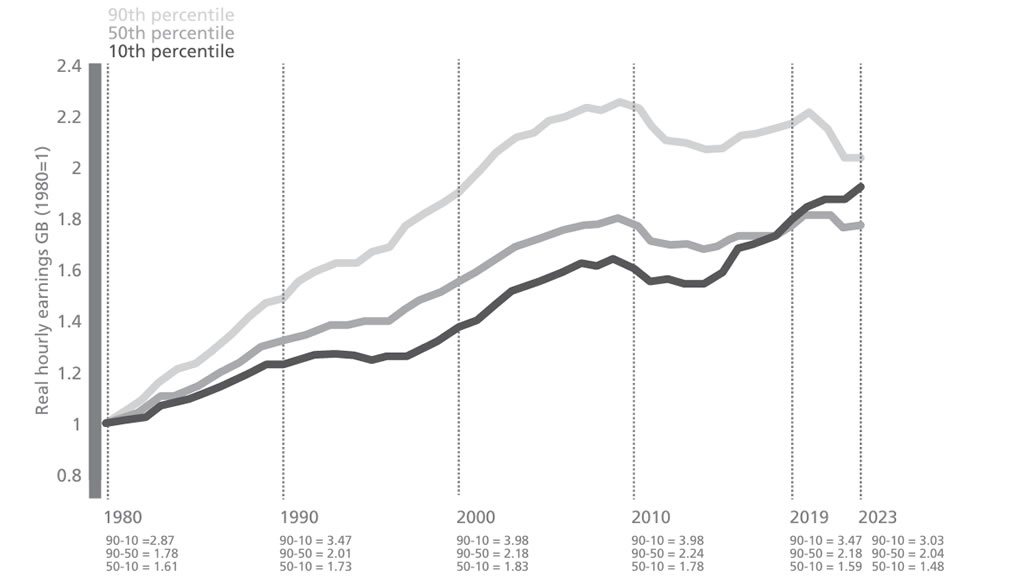
In 1980, a worker at the 90th percentile earned 2.87 times as much as one at the 10th percentile. This rose to a peak of around four times as much in the early 2000s, and then fell back by quite some way, down as far as 3.03 in 2023. Note that the entire 1980-99 increase in inequality between the lower-paid and median-paid workers (the 50-10 ratio) was fully reversed by 2019, and by more since then. This is because the minimum wage boosted the wages of the 10th percentile by a lot.
The evolution of the national minimum wage from its introduction in April 1999 until 2023 is shown in Figure 2. This also indicates how the institutional structure of having several minimum pay rates (which vary by age and, more lately, apprentice status) has altered. The figure makes it clear that the minimum wage rose rapidly over time, and that new minimum wages were added over time.
Figure 2: National minimum wage rates, UK, 1999 to 2023.
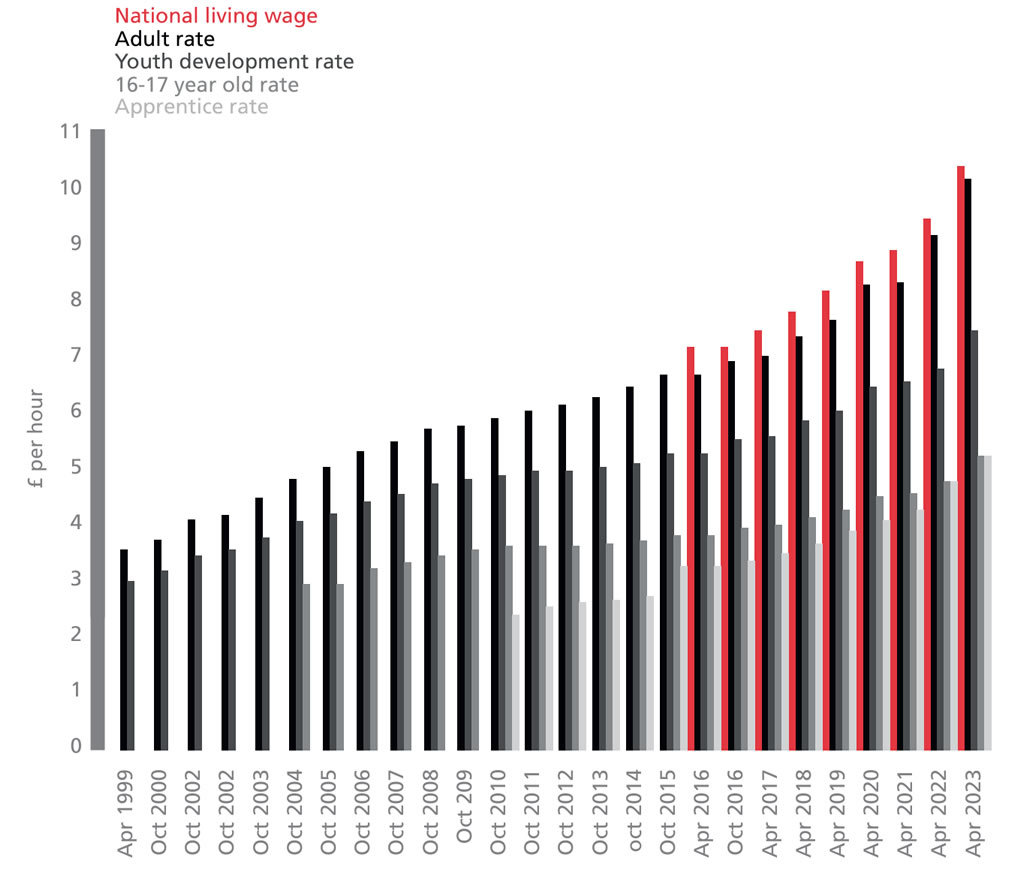
At the time of its inception in 1999, there were just two rates: one for workers aged 22 and over; and another for workers aged 18 to 21. Over time a rate for 16 and 17-year-olds, and for apprentices, also came in. But the most important structural change was the unexpected introduction of the national living wage in April 2016, a substantively higher minimum for workers aged 25 or over, which resulted from George Osborne's hastily announced postelection win budget in July 2015.
In the period of real wage stagnation since 2010, only the lowest paid – beneficiaries of the minimum wage – have seen any significant improvement in their pay

How does the minimum wage relate to the patterns of real wage growth and inequality? The answer is that it strongly relates, and that the minimum wage has strongly affected wage inequality in the labour market, and fully reversed the previous rise in lower tail inequality that occurred before its introduction.
Figure 3 homes in on the real hourly wage growth at the 10th, 50th and 90th percentiles since the introduction of the minimum wage in 1999, and wage growth at the minimum wage level itself. The level of the minimum wage, introduced at £3.60 per hour in April 1999, rapidly climbed to £9.50 by 2023, as shown below, along with the same three inequality ratios as in Figure 1.
Figure 3 shows that real wage growth of the minimum wage was faster between 1999 and 2023 than the real wage growth for either lower, median or higher-paid workers. In fact, of the four lines shown, the minimum wage line grows the most (by 60% since 1999), the 10th percentile also grows (by about 40%) and the 50th and 90th grow by only a small amount. In the period of real wage stagnation since 2010, in the wake of the global financial crisis, only the minimum wage and 10th percentile show growth of any note.
The minimum wage has been a success story, but low earners are more likely than others to face volatile hours
Figure 3: Real wage growth, inequality and the minimum wage.
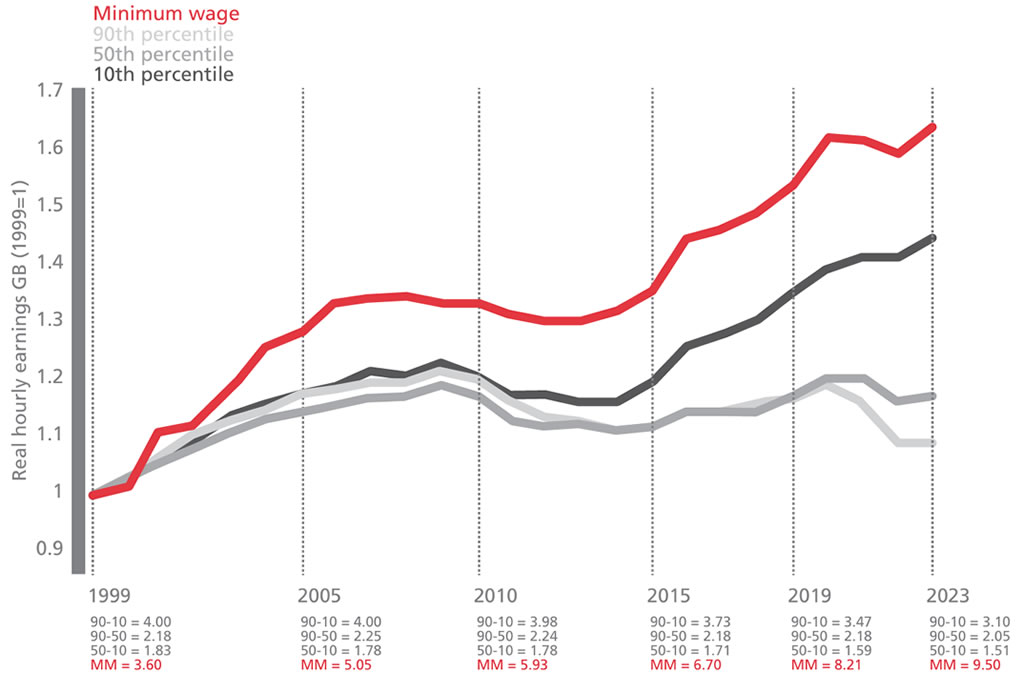
There are two pertinent conclusions that follow. First of all, the minimum wage is the reason why the gap between the median and lowest paid workers (the 50-10 ratio) narrowed between 1999 and 2023, more than wiping out the rise in 50-10 inequality that had taken place from 1980 to 1999. Second, this occurred through a rise in how much lower-paid workers were earning, up to the 10th percentile and possibly a little higher, rather than a drop in the median wage.
The minimum wage has been very successful in raising the pay floor, and in recent work, CEP and the Resolution Foundation propose that it could go even further. The joint project of the Economy 2030 Inquiry recommends setting a new ambition for the minimum wage to reach 73% of median pay (£14 on current forecasts) by 2029, while recognising the need for the Low Pay Commission to remain vigilant to the danger of significant employment effects.
But while the minimum wage has been a success story, the inquiry's final report warns that the job satisfaction of the lowest earners has fallen and emphasises the non-wage dimension of a desire for decent and fair work. Low earners are currently four times as likely as high earners to experience volatility in their hours or pay, or to be working fewer hours than they would like.
Proposals from the inquiry therefore include the right of workers to have a contract enshrining minimum hours that reflect their usual work pattern, employers being required to provide two weeks' advance notice of shifts, tightening up protections against unfair dismissal, and improving sick pay.
The national minimum wage has been highly successful in raising wages and in reducing inequality. Its first 25 years have shown us what is possible, but there is still more that needs to be done to generate both decent work and wages for all.
20 June 2024 Paper Number CEPCP682
Download PDF - The national minimum wage: 25 years on
This CentrePiece article is published under the centre's Labour programme, Community Wellbeing programme, Education programme.