
On the cover: Economic growth
Informing industrial strategy for clean technologies
Ralf Martin, Maxwell Read, Arjun Shah, Anna Valero and Dennis Verhoeven
Spillovers from innovation can boost regional growth

Governments are increasingly turning to industrial policy tools to boost investment, growth and resilience in key sectors, including those relevant for the net zero transition. The UK government's industrial strategy, published in June 2025, sets out a range of policy levers to support eight key sectors in manufacturing and services where evidence suggests that the UK has current strengths and future growth potential.
At a high level, as well as boosting growth, the strategy seeks to "spread prosperity to all parts of the country, make us all more secure and seize the opportunities of net zero." More specifically, in the context of net zero products and services, technologies with growth opportunities for the UK feature in the clean energy sector and advanced manufacturing sector plans, and sustainable finance products are highlighted in the financial services competitiveness strategy.
Our research seeks to inform a strategic approach to growth - where green industrial policies are nested within a broader strategy building on the UK's comparative advantages (Valero and Van Reenen, 2023; De Lyon et al, 2022).
Innovation is central to this. For an innovative economy like the UK, building on the country's research strengths and improving the extent to which new ideas are converted into commercially viable innovations are key to improving productivity performance. And given how crucial innovation is to the net zero transition, much of our analysis has sought to identify areas of comparative advantage and high economic payoff to investments in innovation in clean technologies.
Here we summarise some key findings from the Productive and Inclusive Net Zero (PRINZ) programme and draw out implications for policy and future research.
Clean technologies can generate growth opportunities around the country
In our green industrial policy matrix (Serin et al, 2024), we propose a set of criteria for governments to consider when prioritising specific technologies for support as part of an industrial strategy. These are summarised in Table 1.
Table 1: Overview of criteria assessed under the green industrial policy matrix
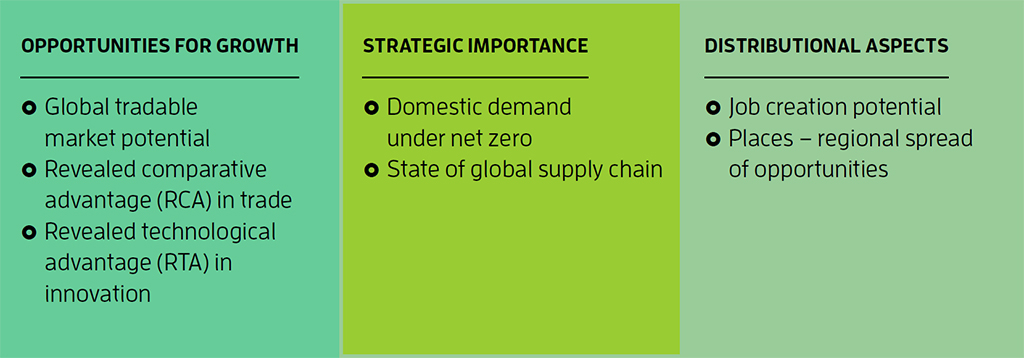
First, to assess overall growth potential, we consider where there is evidence of UK comparative advantage in different technology areas and combine this with information on likely global growth. Given that clean technologies are not easily mapped in standard economic statistics, we consider granular data on traded goods and patents to construct measures of the UK's comparative strengths. More specifically, we calculate revealed comparative advantage (RCA) in traded goods mapped as being relevant for specific clean technologies, and revealed technological advantage (RTA) using more forward-looking innovation data, as measured by patenting in relevant technology classes.
We then consider the strategic importance of these technologies for meeting the UK's net zero commitments, and the extent to which UK supply chain capabilities are needed for resilience purposes given the geopolitical context. Finally, in the green industrial policy matrix, we consider the likely distributional aspects of growth in these technologies, in terms of both potential job creation and the regional spread of opportunities.
For an innovative economy like the UK, improving the extent to which new ideas are converted to commercialised innovations is key to improving productivity performance
We begin with a high-level summary of RTA for seven key clean energy technologies. In Figure 1, the bar length shows RTA and the width represents the volume of innovations globally (number of patents). This measure shows that the UK has RTA on aggregate in offshore wind, nuclear and carbon capture, usage and storage (which all map to frontier sectors in the clean energy sector plan) as well as tidal stream.
Figure 1: The UK's revealed technological advantage in aggregate categories (2016-2020)
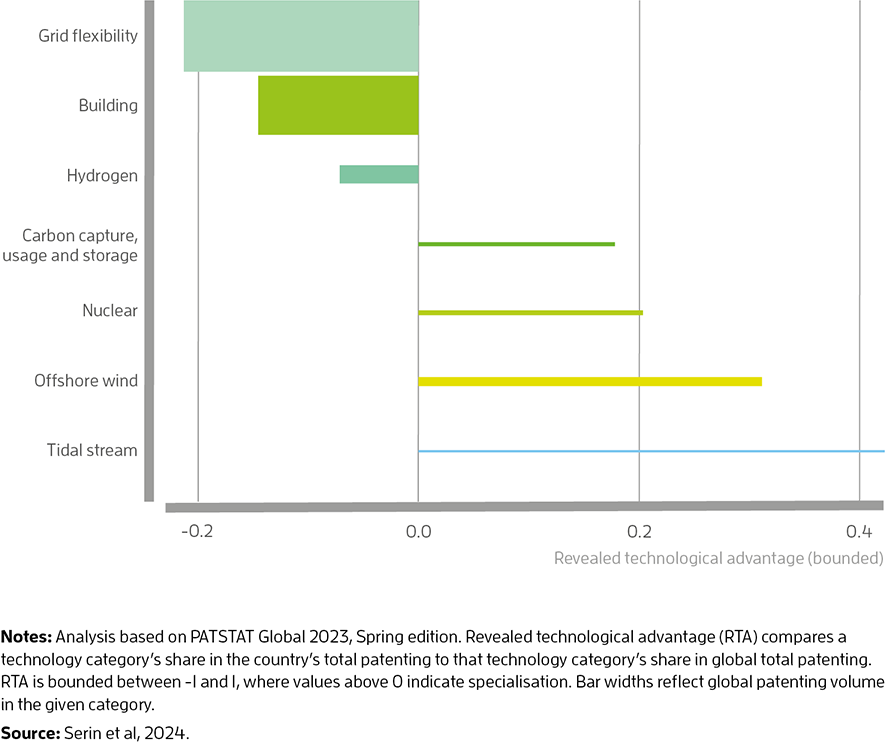
While there are some broad areas - notably grid flexibility and technologies relevant for reducing the carbon footprint of buildings - where the UK has an apparent comparative disadvantage, we can often identify narrower subcategories where the UK still has a relative advantage. This includes heat pumps (another frontier sector in the industrial strategy) within the broad category of heat and buildings. Our broader analysis in the green industrial policy matrix highlights opportunities for regionally balanced growth across many of these technologies, based on the location of businesses in relevant sectors.
A successful industrial strategy should be informed by evidence on where government intervention can be most fruitful, and this is not necessarily or exclusively in areas with the highest comparative advantage. Innovation spillovers - where the benefits of innovation extend beyond the private benefits to the innovator - are a key justification for government investment in research and development (R&D) and broader innovation policy. Where an industrial strategy seeks to boost domestic capabilities and growth, the extent to which spillovers are retained within a country is relevant.
The potential returns from clean energy technologies are particularly high
RTA measures give us an indication of specialisation in a given area of innovation, but tell us less about the economic value that can be generated from further R&D investments in particular technologies. The industrial strategy index (IStraX) methodology provides a framework to provide evidence on this, while accounting for differences in direct and indirect knowledge spillovers between different technology types (Guillard et al, 2021).
Using this methodology, returns for additional investments in specific types of innovation can be estimated accounting for spillovers at the global or national level or for specific regions. The scope of spillovers will matter for different policy objectives. For example, the UK government will primarily be interested in R&D investments that generate knowledge spillovers for UK innovators, whereas the World Bank will be more interested in spillovers to innovators in developing countries.
The basic idea is that the estimated return to investment in innovation for a type of technology reflects the difference between the expected increase in total economic value that it generates (the private value to the innovator, as well as the value created for others through knowledge spillovers) and the expected cost of the subsidy.
Our estimates of the marginal returns for UK innovations over the period 2009-2018 in selected technologies show that while UK green energy innovations generate below average global returns, they generate higher than average national returns, indeed higher than greenhouse gas capture or artificial intelligence respectively. This means that the potential to generate economic benefits in the UK is particularly high for green energy.
Supporting development of clean technologies provides opportunities for regional growth
The next step is to consider regional patterns in these metrics to inform place-based industrial policies. In previous work, we show that in absolute terms, green innovation - just like total innovation - tends to cluster in more productive places, but less productive places tend to be more specialised in green patenting and firms (Curran et al, 2022). We have also applied the IStraX methodology to explore innovation between the "golden triangle" of Cambridge, London and Oxford, and the rest of the country.
We show that investments in clean technologies can play an important role in improving growth outside the golden triangle - both directly via investments in those areas, and indirectly via spillovers from innovation in the golden triangle to the rest of the country.
We extend that analysis, considering estimated returns to investment in innovation in green energy technologies for the UK's 12 regions. We find that the south-east, London and the East Midlands account for the highest shares of green energy patents (and total patents) in absolute terms. But estimated marginal returns are particularly high in the north-east, Wales and the West Midlands. In most regions, marginal returns to green energy technologies are higher than the returns across all technology classes. London is a notable exception, where returns to all technologies are higher than those for green energy alone.
Spillovers from science show how innovation policy supports industrial strategy
Scientific knowledge creates value by serving as an input to the development of new technologies. This value varies across disciplines, institutions and regions - and it depends on the type of technology being considered. Understanding this variation can help to inform efficient targeting of science funding where growth is a key objective.
In Martin et al (2026b), we introduce a method ("science rank") to measure the relative economic value of knowledge spillovers from scientific output into commercial innovations, using a large citation network to assign a portion of the private returns from patented innovations to the scientific work on which it builds. Crucially, our method allows for both direct and indirect flows of value from scientific research to commercial innovations.
We find that more developed countries tend to have higher spillovers on average. The United States has high average spillovers (per scientific publication), second only to Switzerland, and also leads in volume terms.
Where an industrial strategy seeks to boost domestic capabilities and growth, the extent to which spillovers are retained within a country is relevant
The relative ranking of countries in terms of total global spillovers is shown in Figure 2, where we rank Organisation for Economic Co-operation and Development (OECD) countries plus China on this measure. While global spillovers are of interest, perhaps more directly relevant for policymakers focused on industrial strategy is the extent to which spillovers from science are internalised within national borders - whether spillovers from science benefit domestic rather than foreign innovation.
Figure 2: Internalisation of spillovers from science by country
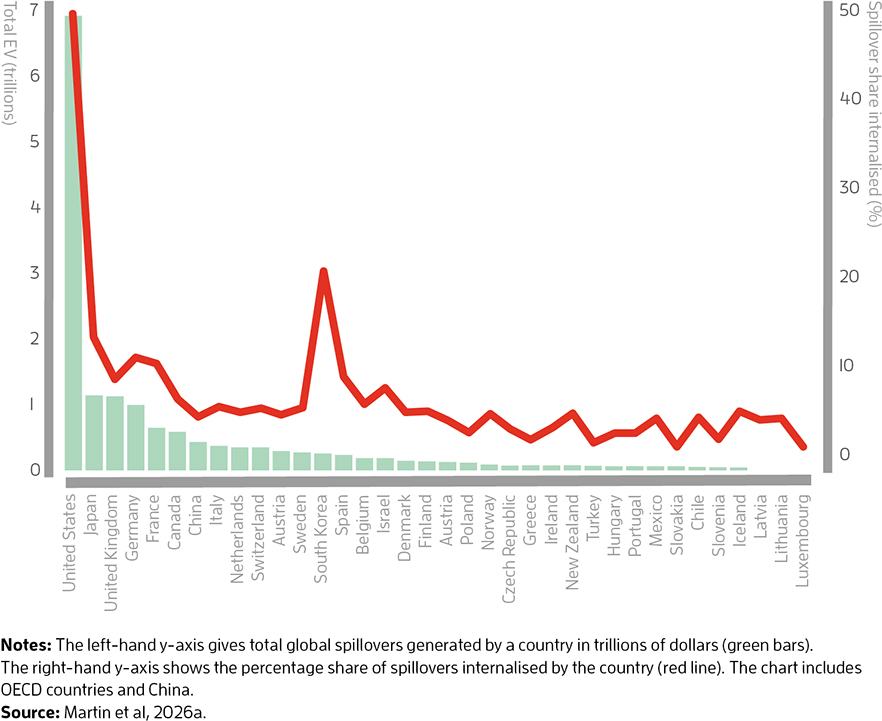
Figure 2 plots this on the right-hand y-axis. This shows that the United States not only leads in terms of overall spillovers, but it also internalises a far higher share (around 50%) compared with other countries - perhaps due to its overall technological development and capacity to apply the findings of science in commercial settings. The share internalised by the UK (below 10%) is lower than that in Japan, Germany and France. While South Korea has lower total spillovers, it stands out for internalising a high share of them (over 20%).
Using these measures, it is possible to consider the spillovers from science into specific technologies of interest, and to explore which countries, disciplines or institutions are particularly important in generating spillovers. To illustrate this, our next step is to consider two specific clean energy technologies that are priority subsectors in the industrial strategy: offshore wind and nuclear. For each, we consider the top 10 UK institutions in terms of the overall monetary value of spillovers generated into related innovation, as shown in Figure 3.
Figure 3: Spillovers into specific innovations in clean technologies by UK institution
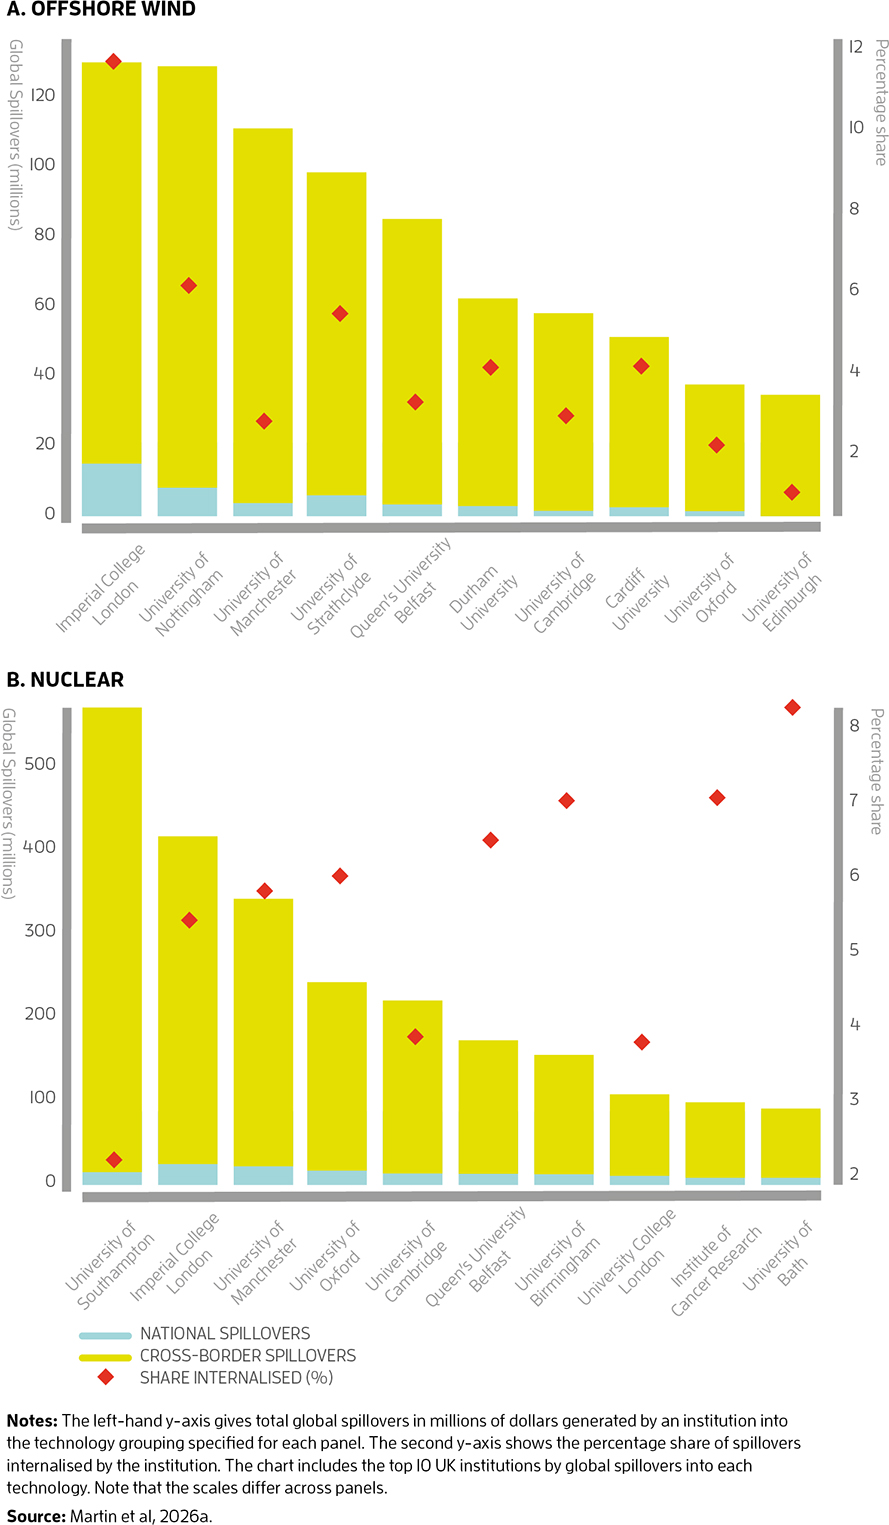
These charts show total global spillovers (yellow), those retained within national borders (blue), and on the right-hand vertical axis, the share of spillovers internalised. The first thing to note is that the scales differ - total spillovers for nuclear are higher than for offshore wind.
The analysis highlights that different universities - in different parts of the country - lead across the different technologies. While the golden triangle universities of Cambridge, Imperial and Oxford tend to feature across all four technologies, we find that Manchester, Nottingham, Southampton and others rank highly in specific technologies - as well as universities in Northern Ireland, Scotland and Wales (such as Queen's University Belfast, Strathclyde and Cardiff for offshore wind).
In most UK regions, marginal returns to green energy are higher than the returns across all technologies
There is also wide variation in shares internalised. For example, both Imperial and Nottingham lead on offshore wind spillovers, but a higher share of Imperial's spillovers is internalised (nearly 12% versus 6%). On nuclear, while Southampton leads on total spillovers and Bath ranks 10th, a far higher share of Bath's spillovers is retained, which means that the amounts of national spillovers generated by the two universities are similar.
Boosting the economic benefits from scientific excellence
Our findings shed light on where the UK's comparative advantages in innovation in clean technologies lie, the extent to which economic benefits from investing in clean innovation are likely to be felt in the UK and the regional patterns that this implies. Looking at patented innovation, we find that clean energy technologies generate higher than average national returns, and that these are particularly high for innovations in regions such as the north-east and Wales.
We take a deeper look at the science that inspires specific clean technology innovations, showcasing a new methodology that shows how universities across the country are generating spillovers from science that benefit UK innovation. The UK's lower share of spillovers internalised relative to some other comparators provides another lens to suggest that the UK can do better at converting its excellence in science to economic benefits within the UK.
Institution-level analysis highlights differences in spillovers from science into specific clean technologies, and the extent to which those spillovers are retained in the UK. Combining this with institutional knowledge and broader measures of effective structures for knowledge transfer and university-industry collaboration can help to build out industrial strategy clusters in priority sectors.
This article is based on Martin, R., Read,M., Shah, A., Valero, A. and Verhoeven, D. (2026a) 'Informing industrial strategy for clean technologies in the UK: the green industrial policy matrix and beyond' in R. Martin and A. Valero (eds) Pathways to a productive and inclusive net zero collection.
Ralf Martin is a principal economist at the World Bank Group and a professor of economics at Imperial Business School. He was the principal investigator of the PRINZ programme and is a research associate in CEP's growth and green transition programmes. Maxwell Read is a research assistant in CEP's growth programme and the Programme on Innovation and Diffusion (POID). Arjun Shah was a research assistant at POID. Anna Valero is a professor in practice at CEP and the Global School of Sustainability at the LSE, director of CEP's growth programme, deputy director of POID and an associate of LSE's Grantham Research Institute on Climate Change and the Environment. Dennis Verhoeven is an assistant professor at SKEMA Business School, a research affiliate at KU Leuven and a research associate in CEP's growth programme.
Further reading
Curran, B., Martin, R., Muller, S., Nguyen-Tien, V., Oliveira-Cunha, J., Serin, E., Shah, A., Valero, A., and Verhoeven, D. (2022) Growing clean: identifying and investing in sustainable growth opportunities across the UK, Resolution Foundation and LSE.
De Lyon, J., Martin, R., Oliveira-Cunha, J., Shah, A., Shah, K., Thwaites, G., and Valero, A. (2022) Enduring strengths: analysing the UK's current and potential economic strengths, and what they mean for its economic strategy, at the start of the decisive decade, Resolution Foundation and LSE.
Guillard, C., Martin, R., Mohnen, P., Thomas, C., and Verhoeven, D. (2021) Efficient industrial policy for innovation: standing on the shoulders of hidden giants, CEP Discussion Paper No.1813.
Martin, R., Shah, A., Valero, A., and Verhoeven, D. (2026b) Spillovers from science, CEP Discussion Paper No. 2165.
Serin, E., Andres, P., Martin, R., Read, M., Shah, A., and Valero, A. (2024) The green industrial policy matrix: informing an industrial strategy for clean energy technologies, LSE.
Valero, A., and Van Reenen, J. (2023) Embedding green industrial policy in a growth strategy for the UK, IPPR Progressive Review.
19 June 2026 Paper Number CEPCP734
Download PDF - Informing industrial strategy for clean technologies
This CentrePiece article is published under the centre's Growth programme.